80m2 Livia Benavides

Armando Andrade Tudela

Bio

Armando Andrade Tudela (Lima, 1975) lives and works in Lyon, France.
Armando’s recent solo shows include: CA2M, Madrid, Spain; Crac Alsace, Alsace, Francia; Museo Tamayo, Mexico City, Mexico; Museu d’ Art Contemporani de Barcelona (MACBA; among many others. He has participated in collective exhibitions with: CRAC Alsace, Alsace, France; Museo Nacional Centro de Arte Reina Sofía, Madrid, Spain; Jumex Museum, Mexico City, Mexico; MACBA, Barcelona, Spain; Guggenheim Museum, New York, USA, among others. His work can be found in the following collections: Centre George Pompidou, Paris, France; Patricia Phelps de Cisneros Collection, New York, USA; Guggenheim Museum, New York, USA; Museu d’Art Contemporani Barcelona, Spain; Museo de Arte de Lima, Peru; Museo Nacional Centro de Arte Reina Sofía, Madrid, Spain; Museum fur Moderne Kunst, Frankfurt, Germany; Museum of Modern Art (MoMA), New York, USA; Tate Modern, London, UK; among others.

Armando Andrade Tudela
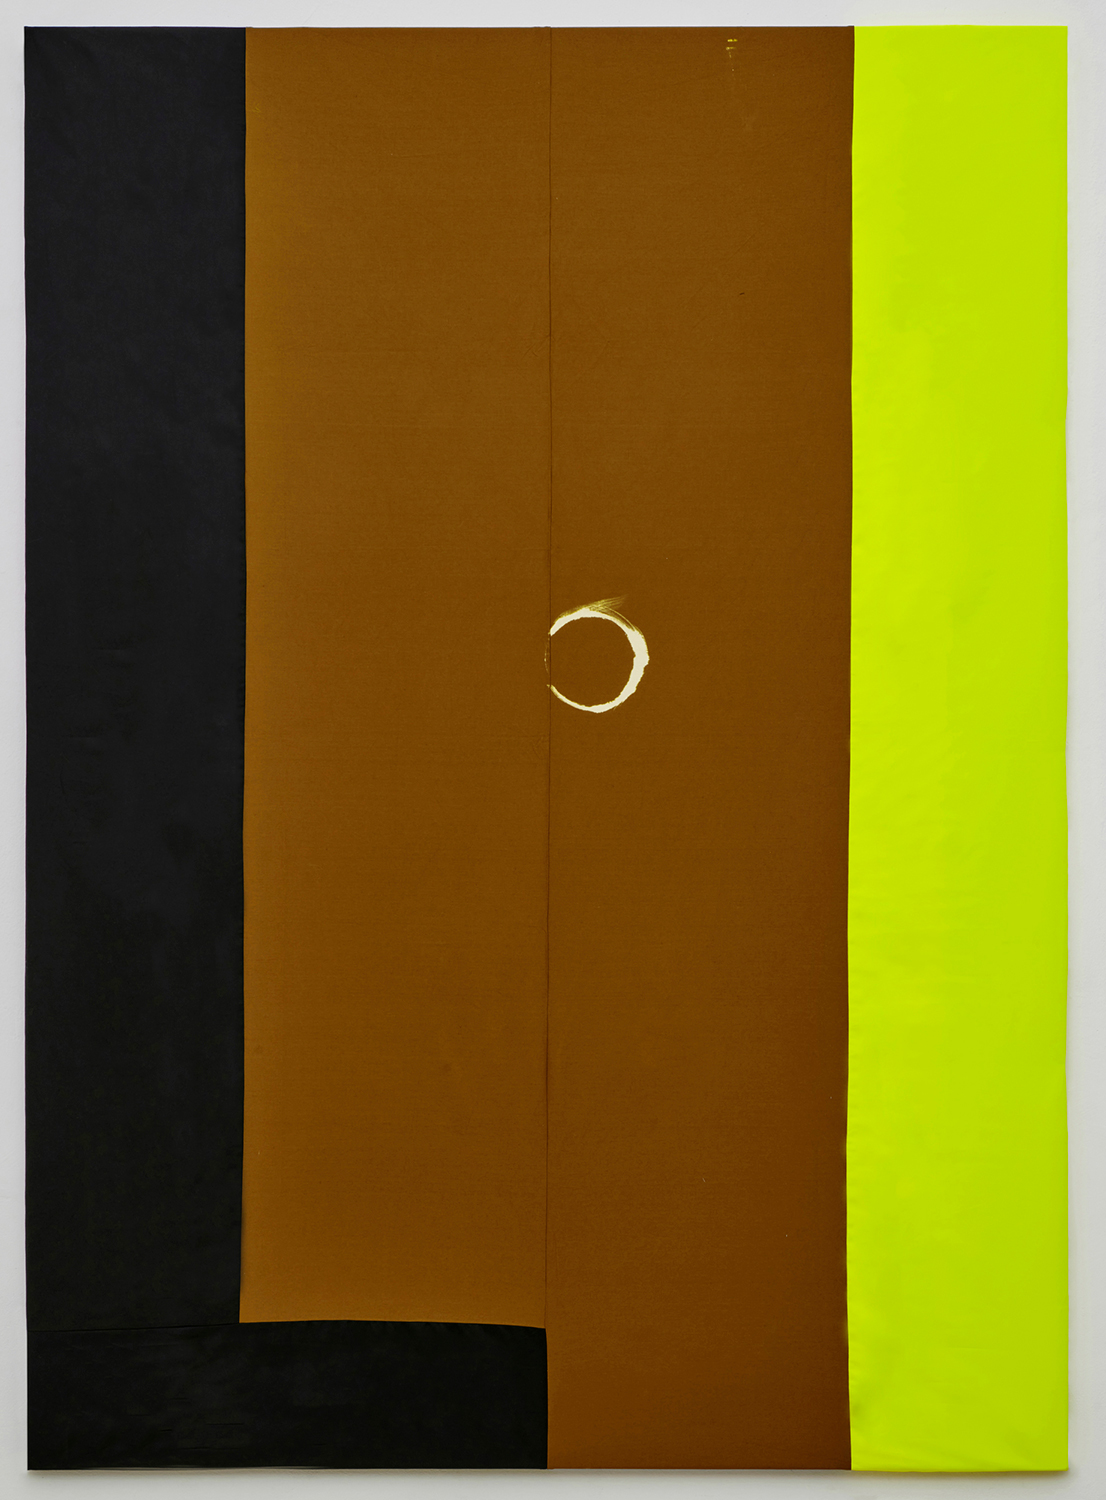
Title: Has #4
Medium: Textil e hipoclorito de sodio
Year: 2021
Dimensions: 230 x 165 cm
Wall reference
2.5 x 4m / 98.4 x 157 in

Other works of 80m2 Livia Benavides

Other galleries

ESPACIO MÍNIMO
Now:
Younique
O ART PROJECT
Vertice Galería de Arte
Factoría Santa Rosa
Has #4

eZ debug

Timing: Feb 10 2026 20:22:25
Script start
Timing: Feb 10 2026 20:22:25
Module start 'content'
Timing: Feb 10 2026 20:22:25
Module end 'content'
Timing: Feb 10 2026 20:22:25
Script end

Main resources:

Total runtime0.0694 sec
Peak memory usage3,072.0000 KB
Database Queries2

Timing points:

CheckpointStart (sec)Duration (sec)Memory at start (KB)Memory used (KB)
Script start 0.00000.0162 922.6641611.1953
Module start 'content' 0.01620.0238 1,533.8594648.0313
Module end 'content' 0.04000.0293 2,181.8906496.9531
Script end 0.0693  2,678.8438 

Time accumulators:

 Accumulator Duration (sec) Duration (%) Count Average (sec)
Ini load
Load cache0.00679.6248140.0005
Mysql Total
Database connection0.00111.579910.0011
Mysqli_queries0.00162.324020.0008
Looping result0.00000.053320.0000
TS translator
TS init0.00284.043120.0014
TS cache load0.00121.756920.0006
TS context load0.00101.512220.0005
Template Total0.027639.710.0276
Template load0.00344.867910.0034
Template processing0.024234.854110.0242
Override
Cache load0.00070.967110.0007
General
dbfile0.018025.9064190.0009
String conversion0.00000.026130.0000
Note: percentages do not add up to 100% because some accumulators overlap

Time used to render debug report: 0.0003 secs