Diana Lowenstein

Alejandra Padilla

Bio

Born in Argentina, continues to live and work there while participating in solo and group exhibitions internationally since 1994. She has received various awards and scholarships. Solo shows: 2017 :20 years with Diana Lowenstein Gallery, Diana Lowenstein gallery, Miami, FL. 2015: Collages and Drawings, Diana Lowenstein Gallery, Miami, FL .2013: ∞, Praxis Chelsea, New York, NY. She has participated in art fairs around the world, and is present in renowned collections.

Statement

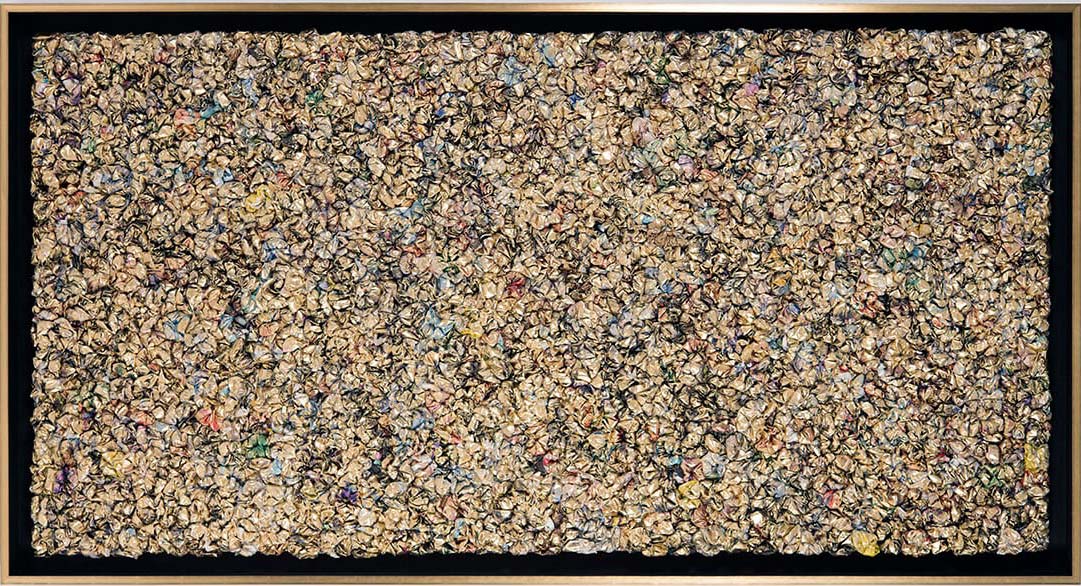
Her work poses questions about the sign’s meaning and the notion of originality. The technique used is collage, and it is based on a meticulous survey on design the artist has been documenting since 1990. Using fragments of those files, she seizes printed images stripping them of their identity in order to give them new readings. Thereby, an image, although evident, may become as ambiguous and polysemic as a word.

Alejandra Padilla
Title: Power
Medium: collage and oil paint on canvas
Year: 2017
Dimensions: 91 x 183 cm-36 x 72 in.
Price: US$ 16,000.00
Wall reference
2.5 x 4m / 98.4 x 157 in

Other works of Diana Lowenstein

Other galleries

ICFAC: International Chinese Fine Arts Council
Zagut
Galería Sextante / Taller Arte Dos Gráfico
COSMOCOSA
ROLF ART
GALERÍA LAURA HABER
Power

eZ debug

Timing: Feb 10 2026 09:57:18
Script start
Timing: Feb 10 2026 09:57:18
Module start 'content'
Timing: Feb 10 2026 09:57:18
Module end 'content'
Timing: Feb 10 2026 09:57:18
Script end

Main resources:

Total runtime0.0362 sec
Peak memory usage3,072.0000 KB
Database Queries2

Timing points:

CheckpointStart (sec)Duration (sec)Memory at start (KB)Memory used (KB)
Script start 0.00000.0084 922.6328611.1875
Module start 'content' 0.00840.0104 1,533.8203649.8750
Module end 'content' 0.01880.0173 2,183.6953499.6406
Script end 0.0362  2,683.3359 

Time accumulators:

 Accumulator Duration (sec) Duration (%) Count Average (sec)
Ini load
Load cache0.00236.2775140.0002
Mysql Total
Database connection0.00102.656610.0010
Mysqli_queries0.00287.608820.0014
Looping result0.00000.098720.0000
TS translator
TS init0.00092.480320.0004
TS cache load0.00061.619420.0003
TS context load0.00051.337820.0002
Template Total0.016545.610.0165
Template load0.00102.811210.0010
Template processing0.015542.725010.0155
Override
Cache load0.00061.577910.0006
General
dbfile0.008021.9884190.0004
String conversion0.00000.041430.0000
Note: percentages do not add up to 100% because some accumulators overlap

Time used to render debug report: 0.0003 secs