Piero Atchugarry Gallery

Túlio Pinto

Bio

The artist pairs dynamic shapes and disparate materials in his captivating sculptural installations. Stressing the material distinctions within his creations, subverts the expectations of these elements and seemingly transports them to a space where the rule of logic, mass, and dimension no longer apply. Pinto shares with the viewer of his work a bit of his whimsy manifest in monumental forms. Born in Brazil in 1974, Pinto earned his college degree in 2009.

Statement

“In the last ten years, I developed research on sculpture and installation with industrial materials, which show in the constitution and in the way they are presented, my intention to promote encounters of different potentials and temperaments; oppositions based on the limits of possibilities. The dialogues promoted by the encounter of different materials are metaphors for the conditions of existence and being."

Túlio Pinto
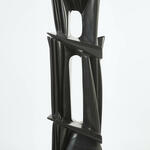
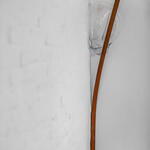
Title: Complicity Vector Corner Situation
Medium: Blown glass and steel
Year: 2018
Dimensions: 223 x 40 x 47 cm - 87.8 x 15.75 x 18.50 in
Edition: Ed. 5 + 2 AP
Price: US$ 18,000.00

Other works of Piero Atchugarry Gallery

Other galleries

Simone Cadinelli Contemporary Art Gallery
El Museo
Art Code Space
Multiplo Espaço Arte
Artium Luz Barros
Quadra
Complicity Vector Corner Situation

eZ debug

Timing: Feb 12 2026 00:49:33
Script start
Timing: Feb 12 2026 00:49:33
Module start 'content'
Timing: Feb 12 2026 00:49:33
Module end 'content'
Timing: Feb 12 2026 00:49:33
Script end

Main resources:

Total runtime0.0327 sec
Peak memory usage3,072.0000 KB
Database Queries2

Timing points:

CheckpointStart (sec)Duration (sec)Memory at start (KB)Memory used (KB)
Script start 0.00000.0089 923.0859611.1797
Module start 'content' 0.00890.0080 1,534.2656649.0859
Module end 'content' 0.01690.0157 2,183.3516498.7578
Script end 0.0326  2,682.1094 

Time accumulators:

 Accumulator Duration (sec) Duration (%) Count Average (sec)
Ini load
Load cache0.00195.8538140.0001
Mysql Total
Database connection0.00123.704210.0012
Mysqli_queries0.00298.973220.0015
Looping result0.00000.101420.0000
TS translator
TS init0.00082.584220.0004
TS cache load0.00051.612220.0003
TS context load0.00041.299420.0002
Template Total0.014945.710.0149
Template load0.00103.153710.0010
Template processing0.013942.502210.0139
Override
Cache load0.00061.764610.0006
General
dbfile0.005015.2886190.0003
String conversion0.00000.043830.0000
Note: percentages do not add up to 100% because some accumulators overlap

Time used to render debug report: 0.0003 secs