BGN / ARTE

Joaquín Sánchez

Bio

Born in Paraguay in 1977. He has been living in Bolivia for more than 20 years. He tells story through photography, sculpture, video, performance and cinema, through an alternate artistic view that never stops.
He always starts his work from an image, even though the image might be a word.
During his childhood he worked as an assistant in his grandfather's traveling cinema, which traveled through Paraguay's rural comunities. Since then, he has a strong connection with the moving pictures. He is in interested in family chronicles, personal memory and small tales that migrate to collective narrations.

Joaquín Sánchez
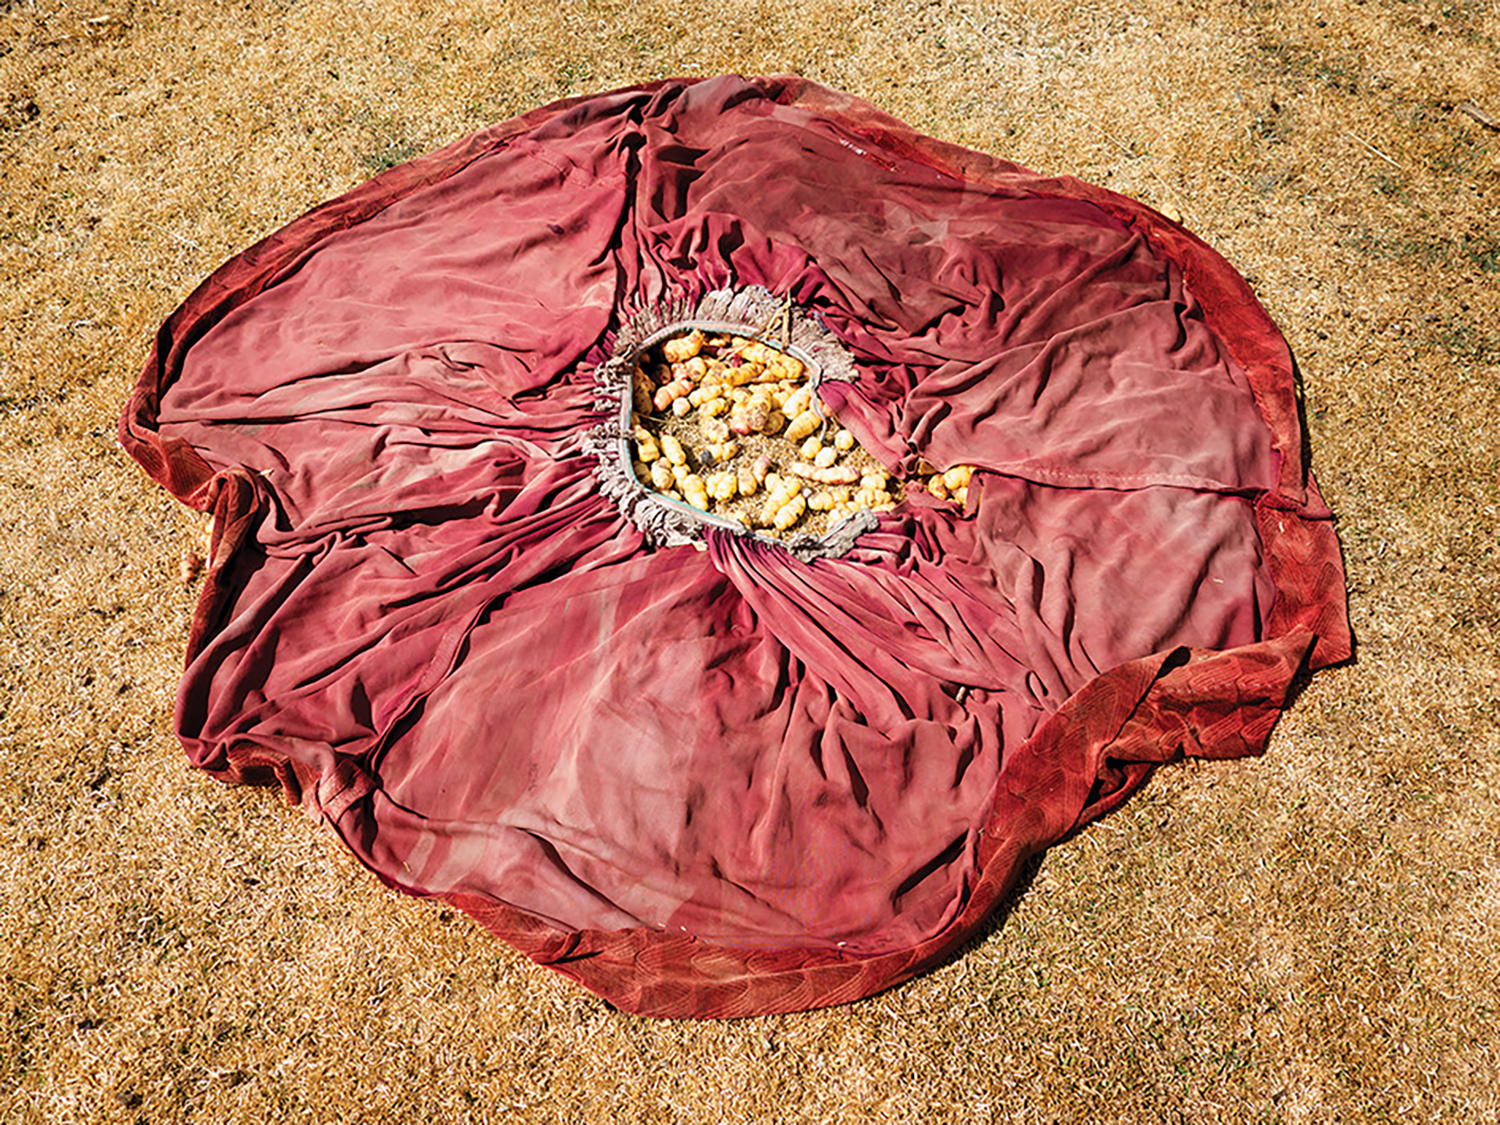
Title: Polleras
Serie: Polleras
Medium: Impresión fotográfica, instalación
Year: 2014
Dimensions: Dimensiones variables
Edition: Edición de (5)
Price: US$ 2,500.00

Other works of BGN / ARTE

Other galleries

(+)GALLERyLABS
Pablo Ávila Arte contemporáneo
Centro Cultural de España Juan de Salazar
EXAEDRO
Espacio Quiroz/Puente
Polleras

eZ debug

Timing: Feb 09 2026 03:45:40
Script start
Error: Feb 09 2026 03:45:40
The parent ID 61065 of element with ID 61080 does not point to the last entry which had ID 62010, incorrect path would be calculated, aborting
Error: Feb 09 2026 03:45:40
eZContentObjectTreeNode::pathWithNames() failed to fetch path of node 16808, falling back to generated url entries. Run updateniceurls.php to fix the problem.
Timing: Feb 09 2026 03:45:40
Module start 'content'
Timing: Feb 09 2026 03:45:40
Module end 'content'
Timing: Feb 09 2026 03:45:40
Script end

Main resources:

Total runtime0.0495 sec
Peak memory usage3,072.0000 KB
Database Queries3

Timing points:

CheckpointStart (sec)Duration (sec)Memory at start (KB)Memory used (KB)
Script start 0.00000.0137 922.7734953.2344
Module start 'content' 0.01370.0139 1,876.0078488.5391
Module end 'content' 0.02770.0218 2,364.5469492.5938
Script end 0.0494  2,857.1406 

Time accumulators:

 Accumulator Duration (sec) Duration (%) Count Average (sec)
Ini load
Load cache0.00244.8529140.0002
Mysql Total
Database connection0.00081.698910.0008
Mysqli_queries0.00204.078930.0007
Looping result0.00010.129630.0000
TS translator
TS init0.00204.066830.0007
TS cache load0.00122.390130.0004
TS context load0.00102.042330.0003
Template Total0.020441.210.0204
Template load0.00132.669010.0013
Template processing0.019138.549910.0191
Override
Cache load0.00081.675310.0008
General
dbfile0.010220.6030180.0006
Note: percentages do not add up to 100% because some accumulators overlap

Time used to render debug report: 0.0003 secs